")
Exploring the Intersection of Sales and Customer Profit and Loss Statements
I’m starting a new weekly sales series focusing on business concepts. Business is at the core of sales. B2B sales don’t happen unless there is a business reason. Therefore, I figured, fuck it, let’s start a series that strengthens all of our business acumen and challenges us all to connect what we sell to our customers business.
We’re going to use the phrase WITCE <wit-cee> (What is the customer experience?) throughout this series. I learned this phrase from the former CIO of T-Mobile. Rob believed the best way to be successful was to look at things from the customer perspective. He’s right and it’s even more important in sales. To be successful, we have to continually be thinking like our customers and always be looking to improve their world.
To kick the series off, I decided to go with the P&L statement or profit and loss statement. It’s one of the most important things in business. A P&L highlights the changes in expenses and income over a specified time period. That could be months, quarters or years.
This is what a P&L statement looks like:
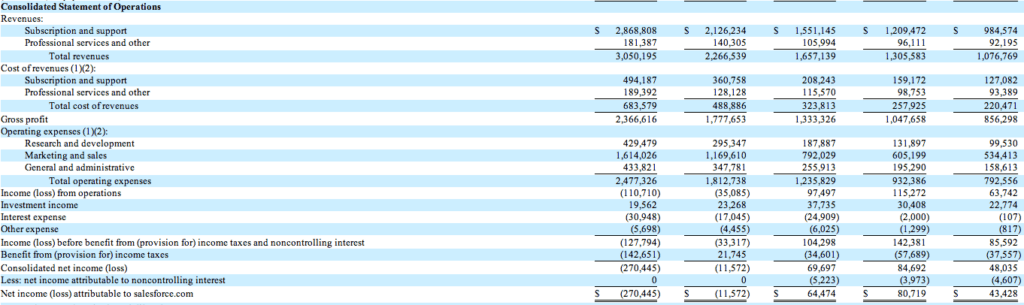
This is Salesforce.com’s Profit and Loss Statement.
The Top Line
The first thing to note about a P&L statement are the top few lines. These are the revenue lines. Thus the term “top line.” The top line is where revenue is found. This is not to be confused with cash. Cash can come from a number of areas besides revenue, such as financing, sale of assets prepaid services etc. Revenue should not be confused with cash. Revenue recognition and cash flow are topics we will tackle later in the series.
Understanding where your customers get their revenue can be VERY important to you. Salesforce.com drives over 95% of their revenue from subscriptions and support. Although services generates over 180 million in revenue, it’s a drop in the hat compared to their subscription revenue. Depending on what it is you are selling, knowing this could play a substantial role in your deal strategy.

The Revenue Line
Just below the revenue line is what’s called cost of goods or total cost of revenue. Total cost of goods or revenue is the total amount of money the company spends to create the product(s)/services or create the revenue. Total cost of goods or revenue are the expenses that directly relate to the revenue being created. In Salesforce.com’s case, expenses associated with creating the platform, hosting the software, development, support resources, services salaries, etc. are all accounted for in total cost of revenue.
Separating expenses related to creating or delivering the product or service from other expenses such as marketing is important because it lets you know how expensive it is to create the revenue. To determine how expensive a product or service is, is a simple equation. Simply subtract total cost of revenue from the revenue. This calculation is called gross margin. Gross margin tells you how much money a company has left over after they’ve spent what they need to deliver or create the product.
In 2013 Salesforce.com’s gross margin was 2.36 billion (Revenue of 3.0b minus total cost of revenue of 683m). This is a very healthy gross margin. It means that it’s not very expensive for Salesforce.com to create 3 billion dollars in revenue. Gross margin is also commonly displayed as a percentage. SF.com’s gross margin percentage in 2013 was 78.6% That is VERY high margin business. High margin businesses have lots of money left over to invest, operate the company, store cash, leverage M&A and more — all good things.
For contrast Amazon’s 2012 gross margin percentage was 24%. It’s much more expensive for Amazon to create their revenue. (note Amazon put their cost of revenue, what they call cost of sales in the operating expense line. This is probably to avoid showing gross margin, due to the fact its a tight margin business)
Operating Expenses
The next line after total cost of revenue is operating expenses. Operating expenses are all the other costs associated with running the business. Normally divided into 3 categories, research and development, sales and marketing and general administration, these expenses include things like sales people’s commissions, marketing expenses, janitorial services, electricity, security etc. Operating expenses are exactly that, expenses required to operate the business.
Unfortunately it’s rare to see a expenses broken down beyond a few rolled up categories, however understanding where your prospects or clients are spending their money and whether or not they are making money could be very valuable in your sales process.
Income From Operations
The next line in a Profit and Loss statement is the juicy one. It’s the income from operations. The income from operations tells you if the company is making money or not. Income from operations is revenue minus expenses. It’s that simple. If the number is positive, the company is profitable. If the number is negative, the company is losing money.
The income from operations number is critical. If it’s positive, the company is creating a profit and assuming their are no cashflow problems the opportunities for selling something to them are high. If the number is negative, your ability to sell something could be hampered. That being said, if what you’re selling can turn that number from a negative to a positive, you will get the attention of a lot of people.
Knowing whether or not your customers or prospects are profitable can be an extremely valuable piece of information. That being said, 10k’s rarely show detailed Profit and Loss by individual business or subsidiaries. Therefore, a group within a larger company that is losing money can have a P&L with positive income from operations. Just because the company as whole is losing money doesn’t mean every aspect of the business is.

Net Income
The line below income from operations includes expenses and income not associated with running the core business. To be sure, they are real expenses, and income, they just aren’t part of the core business. They include interest income, (income from bank balances, money markets, etc.) interest expense (interest paid on company debt) and taxes. Although not key to the core business knowing if your product or service affects these expenses and how is just as important.
The final line after income from operations is net income. Net income is exactly that, net income. It’s what’s left for the business after everyone and everything has taken their piece of the pie. Salesforce.com is running their business at a loss. I’d have to read more of the 10k and do more research to understand why, especially because their gross margins are so high. That being said, 1.6 billion of their operating expenses are in sales and marketing, so one explanation is they are investing heavily in growth. If I’m right and your product or service can help them grow, you are in a good position.
How can a Prospect’s Profit and Loss help you?
Now you have a baseline understanding of what a Profit and Loss Statement is and how to read one. Although not perfect and they don’t tell you everything, they do give you a lot of information, especially when viewed with an eye for trends. How is the P&L trending over multiple quarters and multiple years, etc?
Use the P&L to help you develop your deal strategy, look for opportunities to ask questions and for problems you might be able to solve.
WITCE Profit and Loss Questions:
- Does your product or service affect their Profit and Loss? How?
- Does your product affect the expense side or the revenue side?
- Does your product directly affect your prospects Profit and Loss, like an instant reduction on a particular expense line? Or does it indirectly affect it, such as creating an efficiency that “could” reduce expense or increase revenue? (a product that cuts energy consumption in half directly affects the Profit and Loss. A job sourcing service that finds better candidates faster, indirectly impacts the Profit and Loss)
- What type of company does your product or service best serve, those losing money or those making money?
- What does the Profit and Loss of your prospects and customers look like?
- How much impact does your product or service have on the Profit and Loss?
- Does your product or service initially negatively affect a Profit and Loss and then gradually positively affect it overtime?
- Can you articulate the impact of your product or service in terms of impact to the Profit and Loss?
- How does your customer view their Profit and Loss?
- How does your customers or prospects Profit and Loss affect your deal strategy?
How does your product or service affect the customers Profit and Loss experience? It’s a good thing to know.


Great article, Keenan! The power of profit and loss statements in driving sales strategies cannot be underestimated. Understanding the financial health of your customers is crucial in determining the value your product or service can bring to their business.
“WITCE” (What is the customer experience?) is an excellent mindset to adopt in sales. Putting ourselves in our customers’ shoes and striving to improve their world is key to building successful relationships.